Essay
The Discrete Fourier Transform, From Scratch
How a list of audio samples reveals the frequencies that make up a sound, and the math that makes it work.
If you’ve worked with signals before, you’ve likely heard Fourier transforms come up a lot. The goal of this post is to work through what they actually do, starting with a question about sound:
If I take a block of samples from an audio waveform, how can I figure out which frequencies make up those samples?
The tool we’ll use is the Discrete Fourier Transform, or DFT. For now, think of it as a black box. We feed in a few thousand samples and get back a list of complex numbers called frequency coefficients. Each coefficient measures the contribution of one particular frequency to the block.
But what does it mean for a frequency to be “in” a waveform? Imagine adding a strong Hz cosine wave to a weaker Hz cosine wave, point by point. The resulting waveform has a more complicated shape, even though we made it from two simple repeating patterns. Sine and cosine waves are collectively called sinusoids. The DFT lets us work backwards from the samples of that combined waveform to its sinusoidal components.
There are a few things to unpack here. Why are the output numbers complex when the input samples are real? How does a number describe a frequency? And how much can a finite set of samples tell us about the original continuous sound? That last question matters: the DFT gives us an exact description of the samples, but interpreting them as evidence about the original sound requires some care.
I want to work through the math closely enough that each part of the formula has a reason to be there. We’ll start with how sound becomes numbers, build up the frequency tests, then calculate a complete DFT by hand. The example uses only four samples so we can see every multiplication, including where magnitude and phase come from.
1. From sound to samples
From air pressure to a list of numbers
When you speak, the air pressure near a microphone changes over time. We model those changes as a continuous-time signal: a function with a value at every instant, including the instants when nobody measures it.
A microphone converts the pressure changes into a changing electrical voltage. An analog-to-digital converter (ADC) samples that voltage at evenly spaced times and rounds each measurement to one of its available digital values:
Let’s call the voltage signal . To keep the math simple, we’ll ignore the ADC’s rounding for now. If we take samples per second, then the time between measurements is
This is the sampling rate. For example, means one measurement every of a second. We number the samples starting at zero, so sample is taken at
We use square brackets to distinguish a sample index from a time in seconds. The value at index is just the continuous signal evaluated at that sample’s time:
Each is an ordinary real number. A positive or negative value says which side of the waveform’s zero level we’re on; its size says how far away we are. The DFT can also take complex inputs, but we’ll start with these real audio samples. Pick a finite block containing of them:
These values can be anything. A recording of speech doesn’t have to look like a neat cosine wave for the DFT to work. The sinusoids are the patterns we’ll use to describe the samples, not a requirement we impose on the input.
So what does the DFT give us in place of this list?
The same samples in new coordinates
I’ll put the formula here so we have something to come back to:
We haven’t defined the exponential yet. Set that aside for a moment and look at the input and output sizes:
The lowercase describes the signal in the time domain: what was its value at each sampled moment? The uppercase describes it in the frequency domain: how much of each candidate sinusoid do we need, and where in its cycle should it start? The index picks a sample; the index picks a frequency coefficient.
We’re still describing the same samples. If we keep the full complex coefficients, the inverse DFT can recover every one of them. Think of describing a location by its horizontal and vertical offsets, or by its distance and direction from you. The description changes, but the location doesn’t.
Before we unpack those complex numbers, there’s a naming distinction worth making. The DFT is one member of a larger family of Fourier tools.
Where the DFT fits in Fourier analysis
You may have heard that “any signal is a sum of sines and cosines.” That’s useful intuition, but the precise statement depends on the kind of signal we’re describing:
| Tool | Input | Frequency description | Example |
|---|---|---|---|
| Fourier series | Continuous-time and periodic | Discrete frequencies | An ideal square wave repeating forever |
| Fourier transform | Continuous-time, including non-periodic signals | Continuous frequency variable | One isolated acoustic pulse |
| Discrete-Time Fourier Transform (DTFT) | Discrete-time, finite or infinite sequence | Continuous, periodic frequency variable | An infinite decaying sequence |
| DFT | Discrete-time, finite block | discrete frequency bins | A block of 1,024 audio samples |
For a suitable periodic continuous-time signal, a Fourier series uses a possibly infinite sum of sinusoids. For suitable non-periodic signals, the inverse Fourier transform uses an integral over frequencies instead. The conditions for those continuous-time results are beyond what we need here. The finite DFT has a particularly convenient guarantee: any list of numbers can be written as a combination of its basis sequences. We’ll see why that works below.
First, we need to understand the expression . Everything after that will use the same picture of a point on a circle.
2. From a complex point to a sinusoid
A point on the complex plane
An ordinary real number tells us where we are on a number line. To plot a complex number, we add a second axis at right angles to the first. This gives us the complex plane:
- The horizontal axis is the real axis.
- The vertical axis is the imaginary axis.
Signal processing usually writes the imaginary unit as because is often reserved for electric current. Its defining property is
A complex number has the form
where and are ordinary real numbers. On the complex plane, is simply the point . Move units horizontally and units vertically.
For example, is the point .
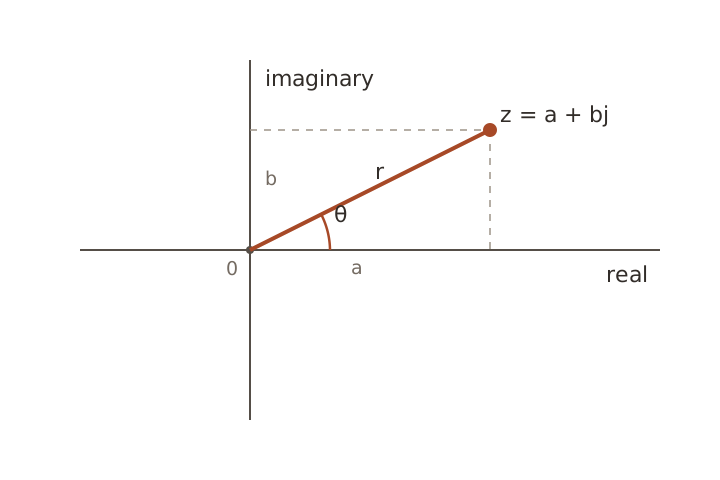
The arrow from the origin to this point has a length
and an angle
The length comes from Pythagoras. The angle needs a little more care: taking alone can’t distinguish, for example, from . The function uses the signs of both coordinates to choose the right quadrant. We measure angles counterclockwise from the positive real axis, with a full turn equal to radians.
If , the arrow has no length and therefore no defined direction. Every nonzero complex number has both a magnitude and an angle.
Draw a right triangle from the arrow to the horizontal axis. Cosine gives the horizontal coordinate divided by the radius, and sine gives the vertical coordinate divided by the radius. Rearranging,
Substitute these coordinates into :
We now have two descriptions of the same complex number:
- Cartesian form: gives horizontal and vertical coordinates.
- Polar form: and give length and direction.
That expression inside the parentheses has another name: . Let’s see where it comes from.
Euler’s formula
Euler’s formula says
All angles in what follows are measured in radians.
At first glance, exponentials and circles don’t seem particularly related. Why should raising to an imaginary power give us those two coordinates?
We can work it out using Taylor series. These express a function as a sum of powers of its input, with coefficients determined by its derivatives at a chosen point. For the exponential, cosine, and sine, the series about zero are
Here , for example, means . These particular series converge for every real or complex input, so we can use the exponential series to define for complex . Replace with :
The powers of repeat every four steps:
Use that cycle and group the real and imaginary terms:
Look back at the two series in parentheses. The first is exactly the Taylor series for cosine, and the second is exactly the one for sine. The powers of supplied all the alternating signs we needed. Since the series converge absolutely, grouping the terms this way is valid.
It lets us rewrite the polar form of any complex number as
The magnitude is the arrow’s length. The angle is its direction.
A fixed angle is a point; a changing angle is rotation
For one fixed value of , is one point:
Its distance from the origin is always one because
That is why these points lie on the unit circle.
Rotation appears only when changes. As the angle increases, the point visits familiar positions:
| Angle | Complex point | Position |
|---|---|---|
| Right | ||
| Top | ||
| Left | ||
| Bottom | ||
| Back to the start |
One complete turn is radians.
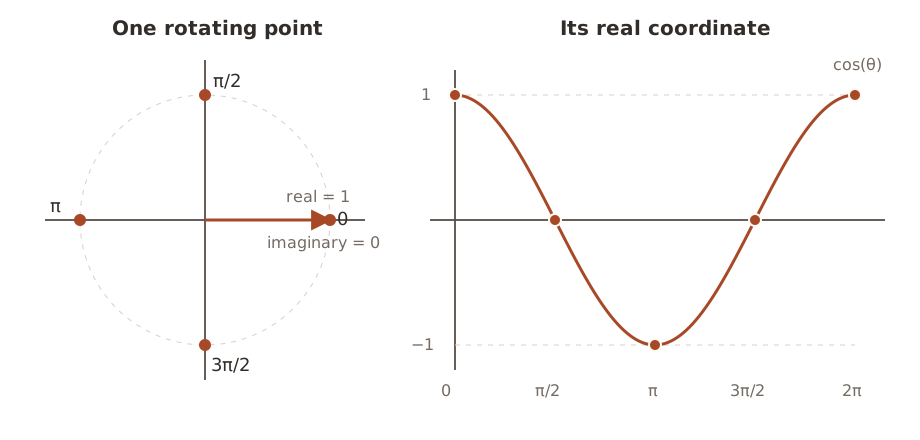
In the figure, we’re plotting the arrow’s horizontal coordinate against angle. At angle zero that coordinate is . A quarter-turn later it’s , halfway around it’s , and eventually it returns to . That’s the cosine wave. Following the vertical coordinate instead gives us sine.
Make the angle change with time
Frequency measures cycles per second. Since one cycle contains radians, a point rotating at cycles per second moves
radians per second. The symbol is called angular frequency.
If we start at angle zero, then after seconds the point has moved
radians. If it starts at some angle , then
If we also allow the circle to have radius , we get
Its three parameters have concrete meanings:
- is the amplitude. On the complex plane, it is the circle’s radius.
- is the frequency in cycles per second, or hertz.
- is the initial phase. It is the starting angle at .
Euler’s formula separates its coordinates:
Note that “phase” can refer to two related things here:
- is the initial phase. It stays fixed.
- is the current angle, sometimes called the instantaneous phase in this simple constant-frequency case. It changes with time.
For example, set Hz and . At second, the current angle is . The initial phase is still zero; it describes where we started, not where we are now. As with any angle around a circle, adding gives the same position.
Why keep the imaginary coordinate?
A physical audio waveform is real-valued. If we want the real cosine
we can obtain it as the real-coordinate projection of the complex rotation:
The operator means “take the real part.” For plotting or playing this known cosine, that’s all we need. The imaginary sine isn’t another physical signal hiding in the microphone recording. We chose to introduce it when we represented the cosine using a point on a circle.
So what does keeping that extra coordinate buy us?
At a single instant, a cosine value does not tell us the point’s full position in its cycle. Both
The real coordinate is zero in both cases. The imaginary coordinate distinguishes them:
If the point is rotating counterclockwise, is where its real coordinate crosses zero going downward, while is where it crosses going upward. The extra coordinate distinguishes those positions. One point alone doesn’t tell us the direction of motion; here we know it from our choice of positive frequency.
But we started with a known cosine. In an actual recording, we don’t know the sinusoid’s phase ahead of time. Suppose we try to find a frequency by comparing the samples with a cosine at that frequency. Could a sine at the same frequency go undetected?
Take four samples of one cosine cycle and one sine cycle:
One way to compare two lists is to multiply corresponding entries and add the results. This is their dot product. Matching signs make positive contributions; opposite signs make negative contributions. For these two lists,
The score is zero, despite the waves having the same frequency. Now compare the sine with itself:
The sine reference catches what the cosine reference missed. Both tests are useful because we don’t know where the wave starts in its cycle.
The DFT keeps both scores in one complex number: the cosine score is its real coordinate, and the negative sine score is its imaginary coordinate. We’ll derive that minus sign shortly. The number’s length combines the two scores, and its angle tells us how they’re divided. That’s how we’ll recover amplitude and phase.
This also explains why real audio samples can produce complex output. We’re making two measurements from the same real list. Before combining those measurements into the DFT, we need to express our sinusoids at the sample times.
3. From sinusoids to the DFT
Move from continuous time to sample number
We already worked out when sample is taken:
So there’s no new kind of sinusoid to invent. Substitute into the one we already have:
The ratio
has units of cycles per sample:
For example, sample a Hz sinusoid at samples per second:
Each new sample advances the complex point by
After ten sample intervals, we’re back at the start of the circle. That means going from to , not from to .
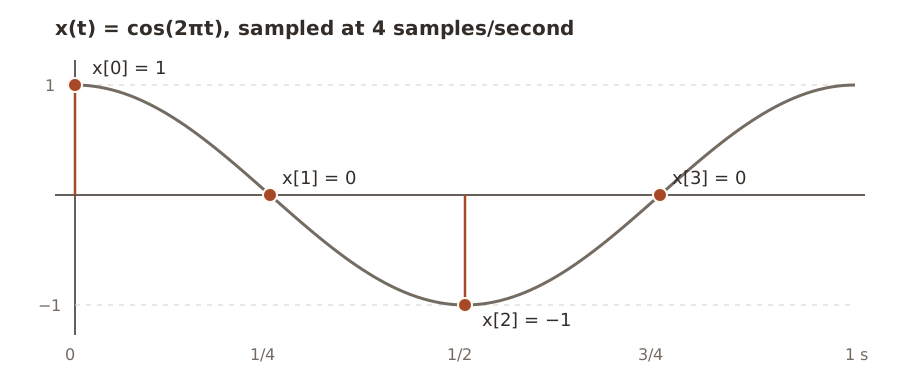
The ratio is worth pausing on. The original tells us cycles per second; dividing by samples per second tells us cycles per sample. It’s the same unit conversion we’ll use when we label the DFT’s frequencies.
Why the DFT uses
So far, has been the frequency of a sinusoid we chose. With a recording, we have the samples and want to find its frequency components. We need to choose some reference sinusoids to test against. The DFT uses a grid of reference frequencies, called bins.
The candidates are indexed by
Candidate has normalized frequency
and angular frequency
Why choose ? The useful property is that these reference sinusoids fit a whole number of cycles into one block period. Multiplying the frequency by sample intervals gives
So candidate completes exactly cycles per -sample period.
There is one indexing subtlety. The stored samples are through . The next hypothetical sample, , lies on the boundary where the block would repeat. At that boundary, the angle is
which lands back at the starting point after complete turns. This makes the reference sequence repeat every samples. It doesn’t mean the real recording repeats forever. We’re choosing periodic reference patterns to describe the one block we have.
For and , the normalized frequency is
Each sample advances by a quarter-turn:
and the point completes two full turns by the periodic boundary at .
To convert the stored bin index into hertz, multiply by the sampling rate:
The units cancel just as we’d expect:
Adjacent bins are separated by
At a fixed sampling rate, taking a longer block gives us more closely spaced bins. Its period is seconds, even though the elapsed time from the first stored sample to the last is seconds. That final sample interval reaches the next block boundary.
Notice that we chose these frequencies ourselves. We haven’t assumed the input contains only tones that land on the grid. A tone between bins can contribute to several coefficients; we’ll return to that after the worked example.
The candidate complex sinusoids
For each bin , define
This is a complex point that advances by radians whenever increases by one. It is the -th candidate sinusoid.
- does not rotate. It is the constant sequence .
- completes one turn per -sample period.
- completes two turns.
- The pattern continues through .
We call these basis sequences because we’ll use them as coordinates for the input. The claim is that a weighted sum of these sequences can reproduce any samples. In a moment we’ll show why they don’t duplicate one another, which is what makes that claim work.
It’s like describing a diagonal arrow using horizontal and vertical components. The arrow doesn’t have to point along either reference direction. Likewise, our input doesn’t have to look like any single .
The DFT as a matching test
We have an arbitrary input and a candidate rotation . We want to measure how strongly they match.
The DFT multiplies the input by the complex conjugate of the candidate and sums over the block:
The complex conjugate of is , written with a star. It reflects a point across the real axis. Applying that to our candidate gives
Using the positive angles in our definition of , the candidate rotates counterclockwise and its conjugate rotates clockwise by the same amount. Why multiply by this opposite rotation? Multiplying complex exponentials adds their exponents, so it gives us a way to subtract the candidate’s angle from the input’s angle.
Suppose the input actually is candidate , with a complex amplitude :
Here is one complex number whose magnitude sets the component’s amplitude and whose angle sets its initial phase.
Multiply by the opposite rotation:
Every rotating sample becomes the same stationary complex number . Summing identical copies gives
The multiplication is asking:
If I unwind candidate frequency , does part of the signal stop rotating and add in the same direction?
For a matching component, all contributions point in the same direction instead of cancelling. A different DFT basis frequency leaves a residual rotation whose contributions sum to zero. That exact cancellation is specific to the bin frequencies; an off-grid tone need not cancel completely.
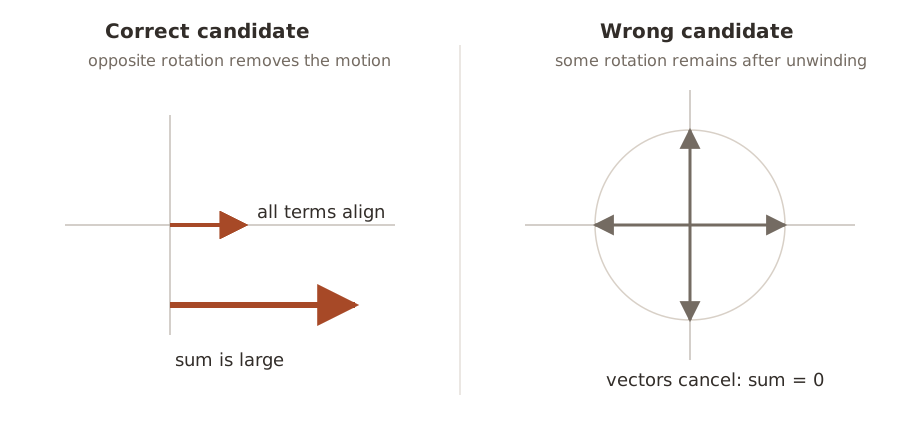
Why wrong frequencies cancel exactly
Let’s check the cancellation rather than relying on the circle picture. Take two bin indices and , both between and .
Suppose the input contains basis frequency :
Test it against bin :
If , every term is , so the sum is .
If , there is some rotation left. Depending on the step size, we might visit all positions around the circle or revisit a smaller set. For example, with and , the terms are . They still cancel. To cover every case, let
Then the sum is the geometric series
You can get that fraction by calling the sum , multiplying it by , and subtracting: . All the middle terms cancel. Here , so the numerator is zero. Our distinct indices lie in , which ensures . The denominator is therefore nonzero, giving
Matching bins add to . Different bins add to zero. This is orthogonality, the same idea as the zero dot product between our cosine and sine lists.
It also explains why the DFT works on arbitrary input. An -sample complex list has complex coordinates. Our nonzero, mutually orthogonal basis sequences are independent: none can be made by combining the others. They therefore span that whole space, meaning every input has a unique expansion
Apply the matching test for bin to this sum. Multiplication and summation distribute over its components. Every term with contributes zero, and the term with contributes . So , or . This is the coefficient we need to rebuild the input later.
What one coefficient contains
Coming back to real audio samples, what are the two coordinates of ? Expand the exponential using Euler’s formula:
Write the result as
Its magnitude is
and its phase is
Here is the cosine score and is the negative sine score. Their combined length measures the size of this frequency coefficient. For a real sinusoid on a bin strictly between zero and half the sampling rate, changing the starting phase rotates its coefficient without changing the length. We’ll calculate this explicitly below, including the scaling needed to turn the coefficient’s magnitude into the real wave’s amplitude. The boundary frequencies need separate treatment.
When , the coefficient is the zero-length arrow, so its phase is undefined. A numerical library may return a conventional value such as zero, but there is no phase to interpret when that frequency has zero magnitude.
Keep track of the minus sign in front of the sine score. It comes directly from . The sign and scaling used here match NumPy’s default DFT convention; other conventions are possible if the inverse is changed to match.
We’ve worked out the general test. Let’s now give it four actual numbers and see what comes out.
4. A complete DFT by hand
I’ll use a Hz cosine sampled four times in one second. A Hz tone is too slow to hear, but the numbers are easy to follow. Once we’ve done the calculation, we’ll change the time scale to an audible frequency without changing any of the arithmetic.
Step 1: Start with a continuous cosine
Choose a cosine with amplitude , frequency Hz, and initial phase :
It completes one cycle per second and starts at its maximum value.
Step 2: Sample it
Sample at
and take samples. The sample times are .
| in seconds | ||
|---|---|---|
The DFT receives this list, with no label telling it that the samples came from a cosine:
Step 3: List the four bins
There are bins, so . The spacing is
Using initially gives Hz. There’s a sampling ambiguity in that last label, though. At the sample times, adding one full turn per sample has no effect:
The last equality holds because is an integer. In particular, stepping forward by of a turn lands at the same point as stepping backward by of a turn. Bin can therefore be read as Hz. A negative frequency describes clockwise complex rotation; it doesn’t mean a negative number of audible vibrations.
We’ll use these labels:
| Bin | Frequency |
|---|---|
| Hz, or DC | |
| Hz | |
| Hz, the Nyquist edge | |
| Hz |
DC means the constant, zero-frequency component. The Nyquist frequency is half the sampling rate, here Hz. At that frequency, positive and negative rotations both give , so they share one bin.
For a general , the same wrapping labels upper-half bins with rather than . The lower-half bins keep their positive labels. When is even, the edge bin can be labeled either or ; the sample sequence is identical.
Step 4: Test the DC bin,
Substitute into the test sequence :
Multiply corresponding entries. I’ll use to denote this element-by-element multiplication:
Then sum:
Since is the sum of the samples, is their average. Here that average is zero, so we have no constant offset.
Step 5: Test Hz,
With , the test angle steps by each time. At , Euler’s formula gives
Multiply:
Sum:
Notice what happened at : the sample is and the test value is also , so their product is . The two nonzero products now add instead of cancelling. We have a nonzero Hz coefficient, though we still need to explain why its value is rather than the original amplitude of .
Step 6: Test the Nyquist bin,
For , the test values alternate between and :
Multiply and sum:
The positive and negative products cancel. There is no Hz basis component in this block.
Step 7: Test Hz,
For , substituting each sample index gives
Multiply and sum:
Another nonzero result, with the same value as bin . Collecting all four sums,
Why one real cosine appears in two bins
Our real signal contained one Hz cosine, so why did both Hz and Hz respond?
Use Euler’s formula twice:
Add them:
Therefore
A unit-amplitude real cosine is the sum of two half-amplitude complex rotations, one counterclockwise and one clockwise. At every sample, their imaginary coordinates cancel and their real coordinates add. Earlier we took the real part of a single rotation to obtain a cosine. Here we’re expressing that same cosine as a sum of two rotations, which is the form the DFT uses for reconstruction.
That is why the DFT found a pair:
- represents the positive-frequency rotation;
- represents the negative-frequency rotation.
This pairing holds for any real input, including speech and noise. To see why, conjugate its DFT sum. The samples stay unchanged because they’re real, while the test exponent changes sign. That is the test for the opposite bin:
Including , we can write it as
The modulo operation wraps the index into , so the opposite of bin zero is zero itself. This relationship is called conjugate symmetry. Paired magnitudes match, and their phases have opposite signs, up to full turns. For even , we only need to store bins through , or coefficients. For odd , we keep through . The remaining coefficients can be recovered from their partners.
Recover amplitude and phase
For the positive-frequency bin,
Its raw magnitude is
Why is the magnitude when the original cosine’s amplitude was ?
Let’s work out both amplitude and phase for a more general cosine. Suppose it lands exactly on a positive-frequency bin , with :
Using the two-rotation identity,
The coefficient of the positive rotation is . Testing bin leaves that number stationary for all samples. The negative rotation is a different basis frequency, so its contribution to this test cancels. We therefore get
This explains both parts of the answer. The arrow has length and angle . The factor came from summing identical contributions; the factor came from splitting the cosine between two rotations. Solving for gives
In our example,
This amplitude formula assumes the unscaled forward DFT we’ve used, a bin-centered cosine, and no tapering window applied to the samples. It isn’t a general rule for reading any physical tone’s amplitude from the nearest peak. We’ll look at what changes when a tone falls between bins in the audio section.
DC and, for even , Nyquist have no separate conjugate partners, so we don’t double them. The signed constant level is . The coefficient multiplies the alternating sequence . These boundary bins don’t provide the same two-coordinate phase measurement as an interior positive-frequency bin.
The phase is the coefficient’s angle:
This is the initial phase relative to sample , not the changing angle of the wave at every subsequent sample. If the coefficient were zero, there would be no angle to recover.
So the DFT recovered
The same frequency at three phases
It’s easy to miss the role of phase when every result is real. Let’s keep the frequency and amplitude fixed and shift the wave’s starting point:
| Real signal | Samples | Raw magnitude | Phase | |
|---|---|---|---|---|
The last line uses
For the sine in the last row, the cosine score is zero and the sine score is , just as we calculated earlier. The DFT combines them as , so its angle is . That agrees with the cosine form of sine above. Using times the sine score here would give the wrong phase for our convention.
All three coefficients have length , which converts to real amplitude after multiplying by . Their angles differ because the waves start at different points in the cycle. If we threw away those angles and kept only magnitudes, we couldn’t tell these three sample lists apart.
We can check the whole phase relationship without choosing a particular angle. Four samples of are
Multiply by the bin- test and sum:
Changing rotates this coefficient. Changing changes its length. The two numbers in a complex coefficient are doing separate, measurable jobs.
Reconstruct the samples with the inverse DFT
The inverse DFT is
We already found the reason for this formula: each basis weight is . Multiply each original basis sequence by its weight and add them. That’s why the exponent is positive again and why the sum has a factor of .
For our example, only and are nonzero:
Bin is the Hz rotation, so this is
Using the identity we derived earlier,
If we check each position before cancelling the imaginary parts, the reconstruction is
| Positive rotation’s contribution | Negative rotation’s contribution | Sum | |
|---|---|---|---|
So the inverse gives us
exactly the samples we started with.
Why spend this much time on four numbers? They let us check everything the DFT claims to do: identify a matching frequency, reject the other basis frequencies, recover amplitude and phase, and reconstruct the input. A software library does the same calculation on a larger block, where writing out every product would be impractical.
We can also make this an audible example without changing the list. Sample a Hz cosine at samples per second and take four samples. The ratio is still , so the input remains and its DFT remains . Bin now means Hz. The sample values determine the DFT coefficients; the sampling rate tells us how to label them in hertz.
5. Return to real audio
What if the samples are not a sinusoid?
They usually aren’t. Speech and music contain overlapping components, and their amplitudes and frequencies can change while we’re recording. But we’ve already shown that the basis sequences span the space of all -sample lists. The samples don’t need to come from a single pure tone.
There’s another useful consequence of the multiply-and-sum formula: the DFT of a sum of signals is the sum of their DFTs. If we add a second tone to our first, its coefficients are added to the result. This property is called linearity.
Take the opening example: a cosine at Hz with amplitude , plus one at Hz with amplitude , both starting at phase zero. Sample at Hz and take samples. The bin spacing is Hz, so the tones land exactly on bins and .
From for these zero-phase cosines, the positive-frequency coefficients are
Their negative-frequency partners are bins and , with the same values. All other coefficients are zero in exact arithmetic. We can recover the two amplitudes as and , even though we fed the DFT the sum of the two waves. The four-sample example scales directly to a mixture at audible frequencies.
This is useful for more than drawing a spectrum. Suppose we multiply both Hz coefficients by and take the inverse DFT. We get the same Hz component and an Hz component with amplitude . We’ve changed the balance of the sound by changing two numbers. We adjust both partners so that the reconstructed samples remain real.
An equalizer extends this idea to ranges of frequencies. In practical audio processing, handling block boundaries also matters; abruptly editing and joining independent blocks can introduce artifacts. But the reason to work in frequency coordinates is already visible in this example. They let us address parts of a signal that are mixed together in the waveform.
Other uses include:
- Looking for harmonics: peaks at a fundamental frequency and its integer multiples, like and Hz.
- Locating a persistent hum or a broad band of noise in a recording.
- Measuring spectral patterns that help distinguish instruments or speech sounds. The largest peak alone need not be the perceived pitch.
What if a sound changes during the block? The full complex DFT still contains enough information to reconstruct those changes, but a single magnitude plot has no time axis. It doesn’t directly show us when a tone appeared. For that view, we take short, usually overlapping blocks, apply a window to each, and compute their DFTs. This is the Short-Time Fourier Transform (STFT). Plotting magnitude or squared magnitude against both time and frequency gives a spectrogram, often displayed on a logarithmic scale.
Practical details the clean example hides
The arithmetic above was exact because we chose tones that fit the bins. With an actual recording, there’s a difference between reconstructing the samples and identifying the physical sounds that produced them. The DFT always gives us the former. These are some things to account for when attempting the latter.
Bin spacing and observation length
The distance between bins is
Our samples at Hz cover a block duration of seconds, giving bins Hz apart. Recording twice as long gives bins Hz apart. But a longer block also combines more of the sound’s evolution into one spectrum. That’s the tradeoff when choosing a frame length for a spectrogram: short frames help locate changes in time, while long frames help separate nearby tones. Bin spacing alone isn’t the full measure of how well we can separate tones; the window and noise also matter.
Spectral leakage
What if we replace the Hz tone with Hz? In a second block it completes cycles, so none of our integer-cycle basis sequences matches it exactly. Its DFT generally has contributions across many bins, strongest near the tone. This spreading is called spectral leakage. The reconstruction is still exact; it just takes more basis components to represent those samples.
Repeating the block helps explain this. An off-grid sinusoid generally doesn’t continue smoothly when we restart the recorded segment, so its periodic extension needs additional frequencies. Be careful with the endpoints here: we don’t require the last stored sample to equal the first. Our leakage-free cosine didn’t satisfy that either. The first sample of the next period comes one sample interval after the last stored sample.
A window is a list of weights applied before the DFT, so we transform . A tapering window gives less weight to the ends of the block. Common choices reduce distant leakage at the cost of widening the central peak. They also change amplitude scaling, so our earlier shortcut no longer applies unchanged. SciPy’s spectral analysis tutorial shows these window and scaling tradeoffs in more detail.
Aliasing and the Nyquist limit
After sampling, frequencies separated by an integer multiple of produce the same samples. We therefore cannot distinguish every possible continuous frequency from discrete samples alone.
For real audio, we conventionally show nonnegative frequencies up to the Nyquist frequency,
The negative-frequency half is determined by conjugate symmetry. But that redundancy doesn’t prove that the analog sound contained only frequencies below . A higher-frequency tone can produce exactly the same samples as a lower one. This ambiguity is aliasing, and the DFT cannot undo it.
For example, at samples per second, and both give at our four sample times. We know which signal we used in the worked example because we chose it. The DFT alone can’t make that distinction.
This is why recording systems use an anti-aliasing filter before sampling, to suppress frequencies outside the intended band. In the ideal sampling theorem, a signal band-limited strictly below can be recovered from its complete, exact sample sequence. “Band-limited” here means it has no frequency content at or above that limit in absolute frequency. A finite block of rounded ADC values is a more limited observation. MIT’s notes on sampling and reconstruction develop this distinction further.
The strict boundary matters. At exactly , a sine with zero initial phase gives at every sample. Its continuous oscillation vanishes from the recorded sequence. We shouldn’t use the Nyquist bin to infer an arbitrary analog sinusoid’s amplitude and phase as though it were an interior bin.
Magnitude, power, and phase are different views
For a coefficient :
Magnitude measures coefficient size. Squared magnitude is related to signal energy: with our DFT convention, the block’s mean-square sample value is , summing all bins. Converting that to physical power requires knowing what the sample values represent. A power spectral density additionally describes power per unit frequency, so its normalization involves frequency spacing and, when used, the window.
Phase carries alignment information. Our three phase-shifted four-sample signals had identical magnitude spectra but different samples. A magnitude-only plot is useful for seeing prominent frequencies, but those magnitudes alone aren’t enough to reconstruct the sound.
Zero-padding does not create new resolution
We could append zeros to our measured samples and compute a larger DFT. That evaluates the same finite recording’s DTFT at more closely spaced frequencies. The plot becomes smoother and a peak may be easier to locate, but we haven’t listened to any more sound. Closely spaced tones that were unresolved in the original observation don’t become separable merely because we drew more points. This MathWorks example illustrates what zero-padding can do for amplitude estimation.
All of these details affect how we interpret a spectrum. None prevents the inverse DFT from reconstructing the finite list we actually transformed. If we tapered it first, that list is the windowed samples; if we padded it, it includes the appended zeros.
6. The whole DFT in one pass
Coming back to the formula at the start of the post,
- Choose a frequency bin .
- At each sample , evaluate the opposite-rotation test .
- Multiply that complex point by the real sample value .
- Sum all results.
- Read the resulting complex number . Its length gives the coefficient magnitude; its angle gives the component’s initial phase when that magnitude is nonzero. Convert to real sinusoid amplitude using the appropriate scaling.
- Repeat for all .
The inverse DFT takes those coefficients, rebuilds every basis rotation, and adds them to recover the samples.
The two views agree. Multiplying and summing measures the basis weights; adding the weighted basis sequences reconstructs the input. That’s why the same transform can help us inspect a recording and then edit it.
7. From the DFT to the FFT
If we wrote code that followed our hand calculation literally, we’d loop over the samples once for every bin. For each new bin we’d calculate another set of rotations and another sum.
The direct formula computes terms for each of bins. That requires work proportional to
With , that’s sample-times-test terms for a single transform. If we’re processing overlapping audio frames continuously, that work adds up.
But those rotations aren’t unrelated. We’ve already used the fact that powers of repeat and that adding full turns leaves the sample values unchanged. The Fast Fourier Transform (FFT) uses symmetries in the DFT to reuse work across bins, reducing the cost to order
The mathematical result is the same DFT. An FFT changes how we calculate the coefficients, with ordinary floating-point rounding in a numerical implementation. We don’t give up frequency bins or discard phase to get the speedup.
The next post will start by splitting the samples into even and odd indices. That gives us two smaller DFTs. The interesting question is how to combine them without doing all the work again, and the answer comes from the same complex rotations we’ve been using throughout this post.